
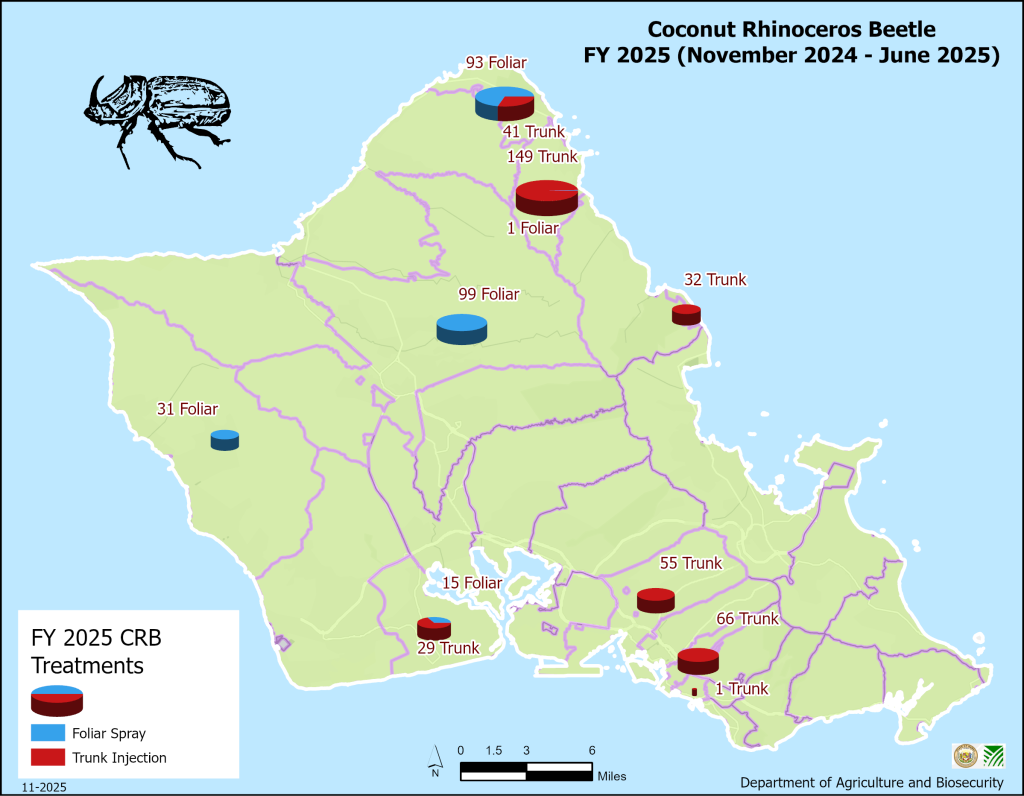
Map represents the type of treatment used to treat trees for Coconut Rhinoceros Beetle in each Zip code in State of Hawaii current Fiscal Year 2026 up until end of September 2025.
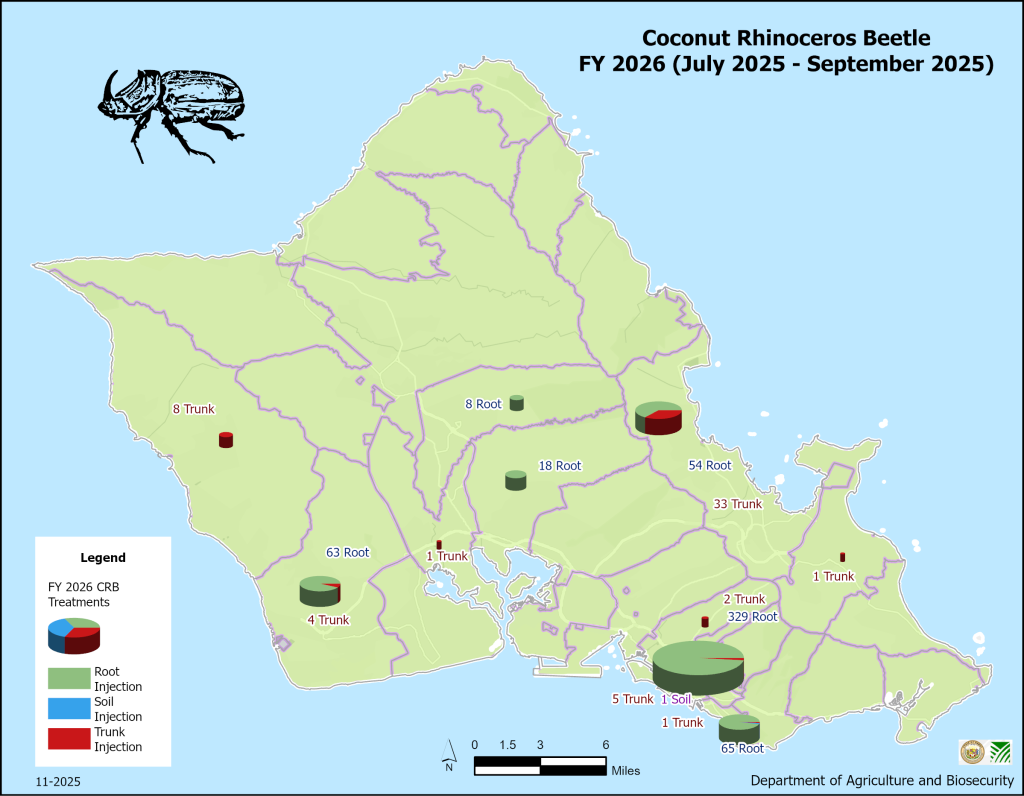
Map shows the number of trees treated in each ZIP code and breakdown of treatment method used to treat the trees for Coconut Rhinoceros Beetle in Fiscal Year 2026 up until end of September 2025.
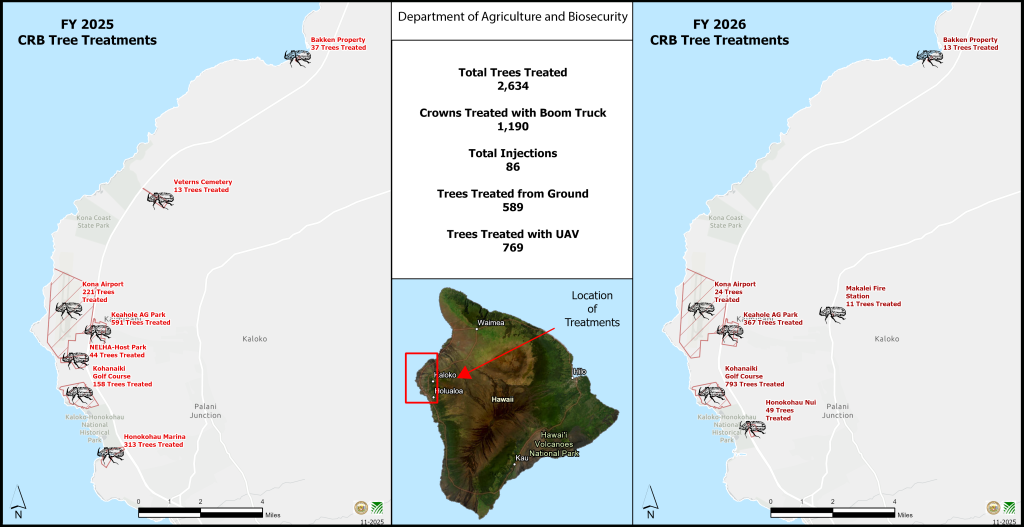
Maps represent the number of trees treated for CRB at each location in West Hawaii Island during the Fiscal Year 2025 and Fiscal Year 2026 up until September 15, 2025. The numbers for Total Tree Treated show the amount of tree treated with the different application methods.
The FY 2025 CRB Treated Trees Dashboard has the total number of trees treated for Coconut Rhinoceros Beetle and breaks it down by the type of tree treated. The middle graph breaks down the number of trees treated by ZIP code. The bottom graph tabs will show the type of treatment, type of tree, type of property, and type of application all by ZIP code.
The FY 2026 CRB Treated Trees Dashboard has the total number of trees treated for Coconut Rhinoceros Beetle and breaks it down by the type of tree treated. The middle graph breaks down the number of trees treated by ZIP code. The bottom graph tabs will show the type of treatment, type of tree, type of property, and type of application all by ZIP code. These numbers represent work done up until October 31, 2025.
The CRB Response Team Data Dashboard will show the number of responses, responding agencies, response type and treatment type. The middle graph will show the number of trees treated by Zip code. The bottom tabs will the number of trees treated by Zip code and the number of trees treated by each agency in each Zip code.
The CRB Response Team Data Dashboard will show the number of responses, responding agencies, response type and treatment type. The middle graph will show the number of trees treated by Zip code. The bottom tabs will the number of trees treated by Zip code and the number of trees treated by each agency in each Zip code. These numbers represent work done up until October 31, 2025.