
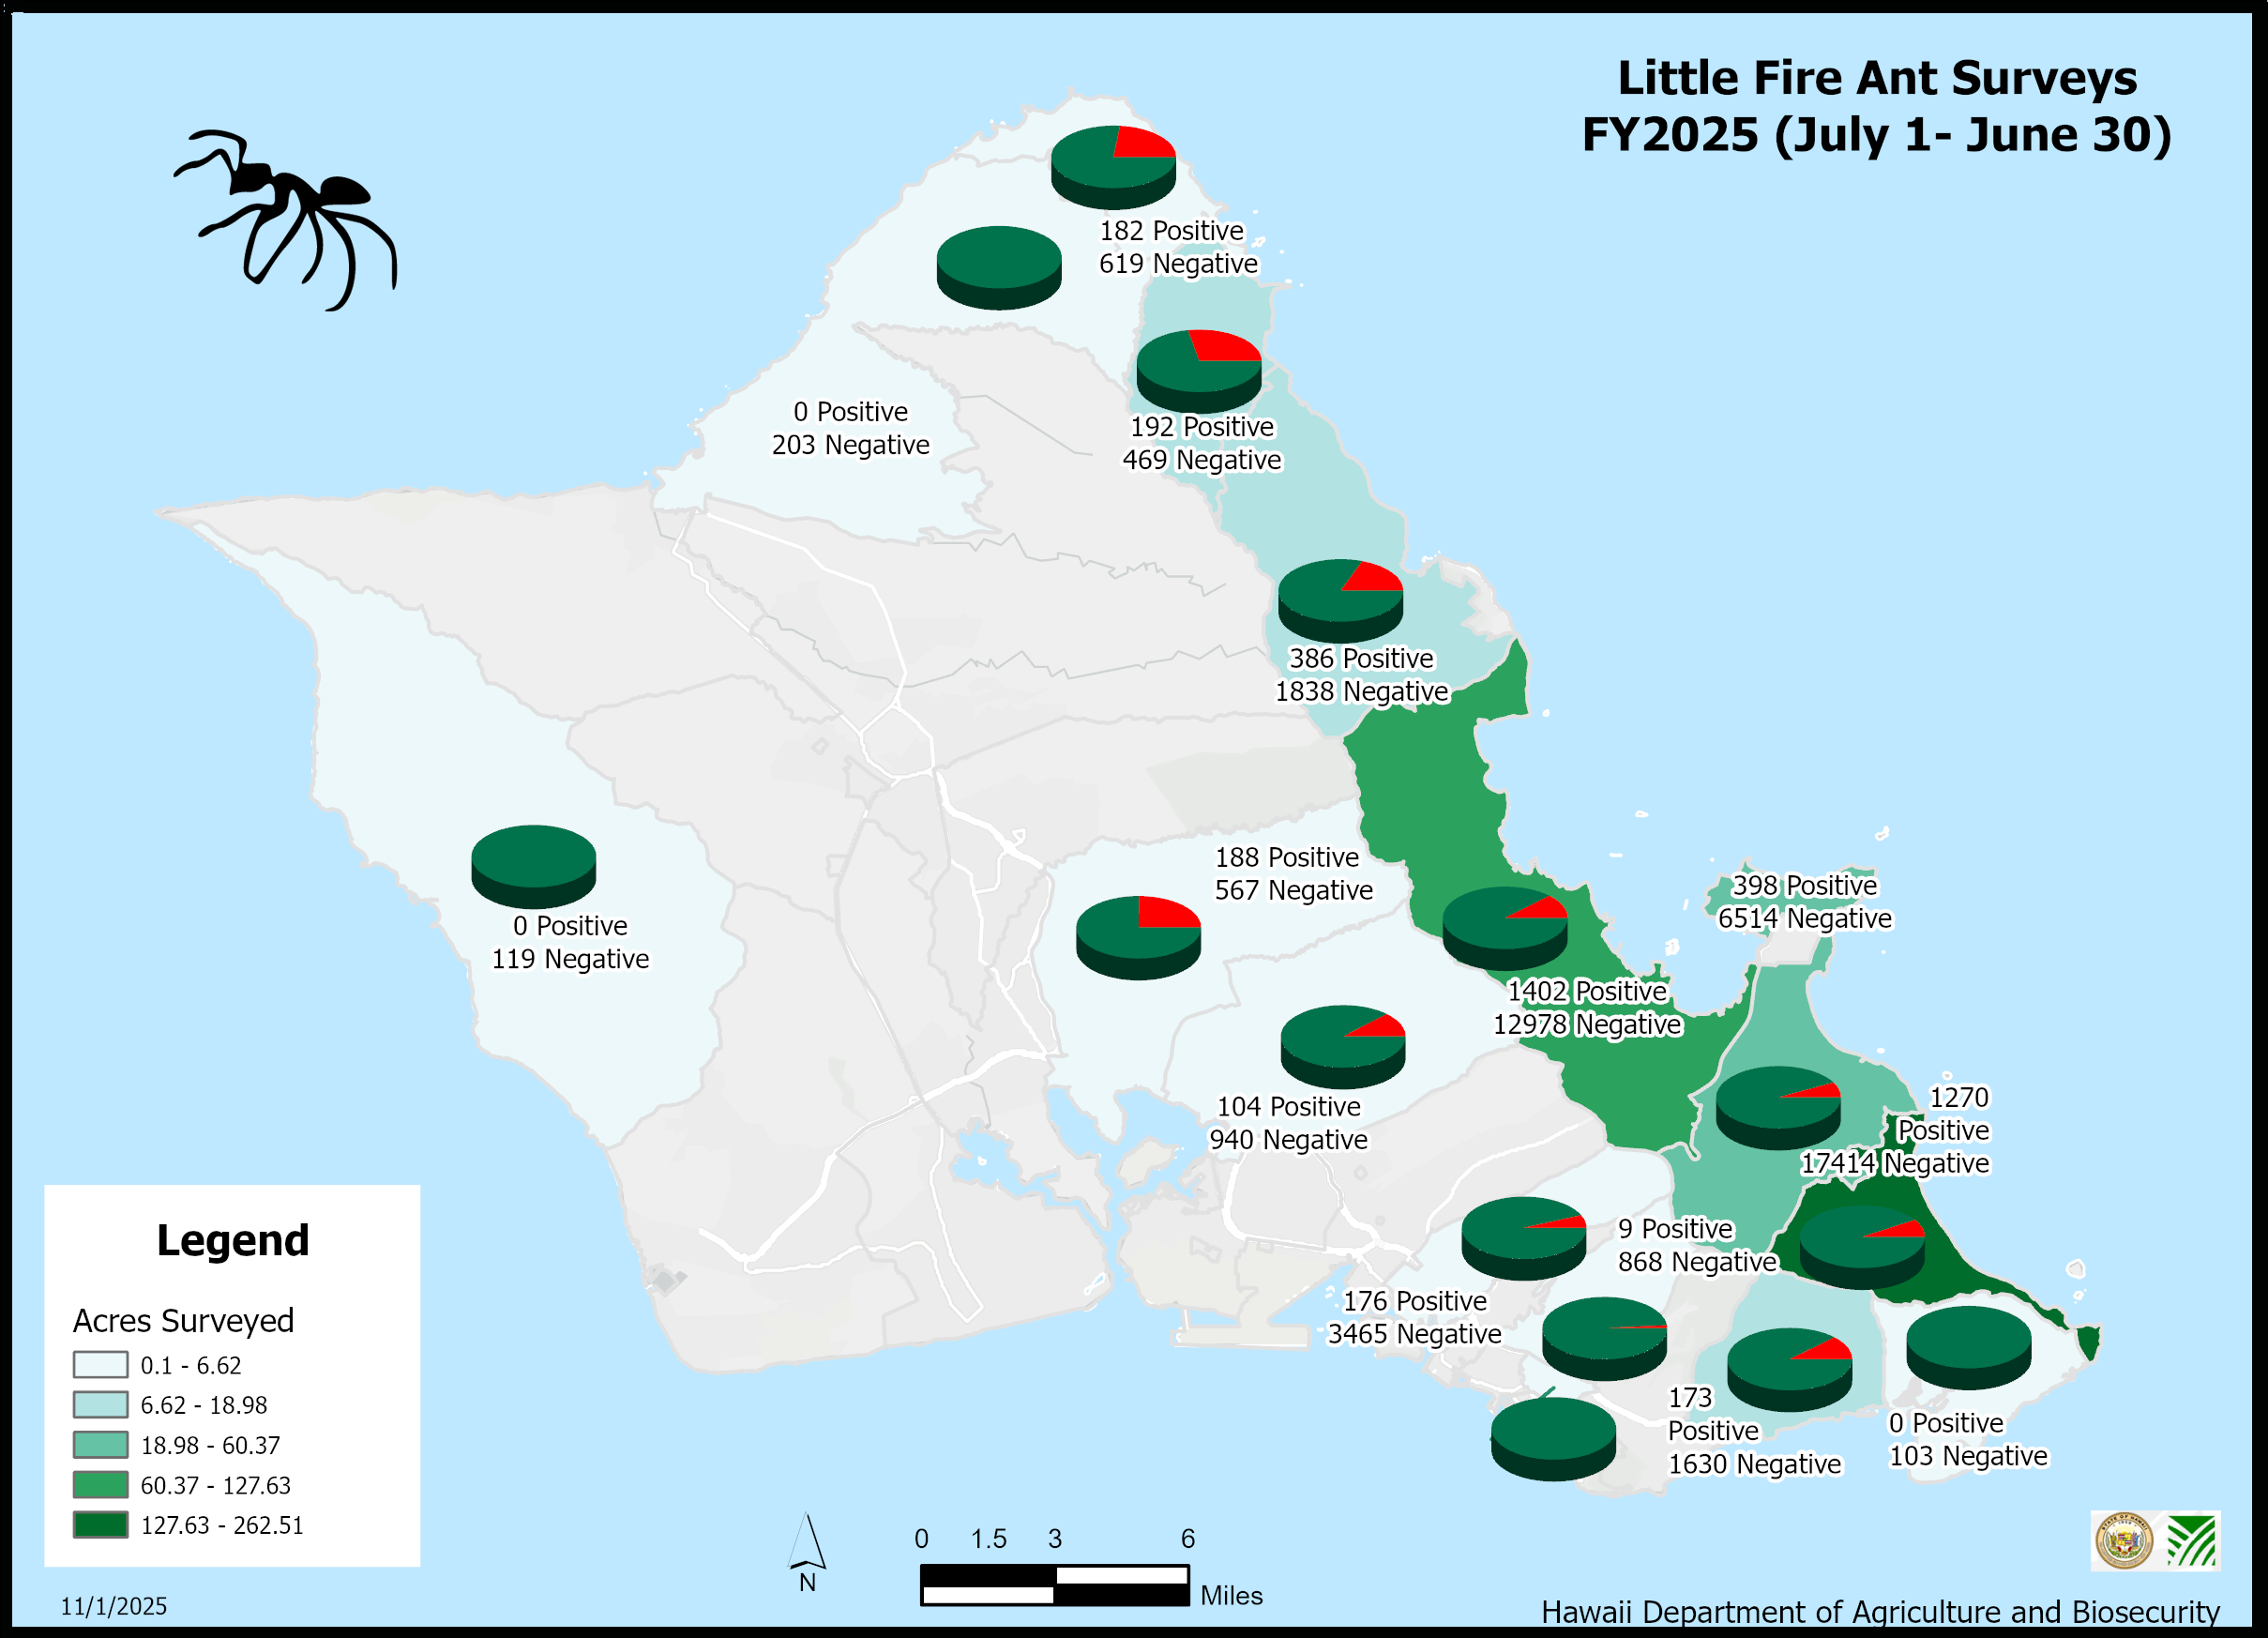
Map represents the number of positives and negative samples found in each Zip code for the Fiscal Year 2025. The darker the ZIP code, the more acres sampled.
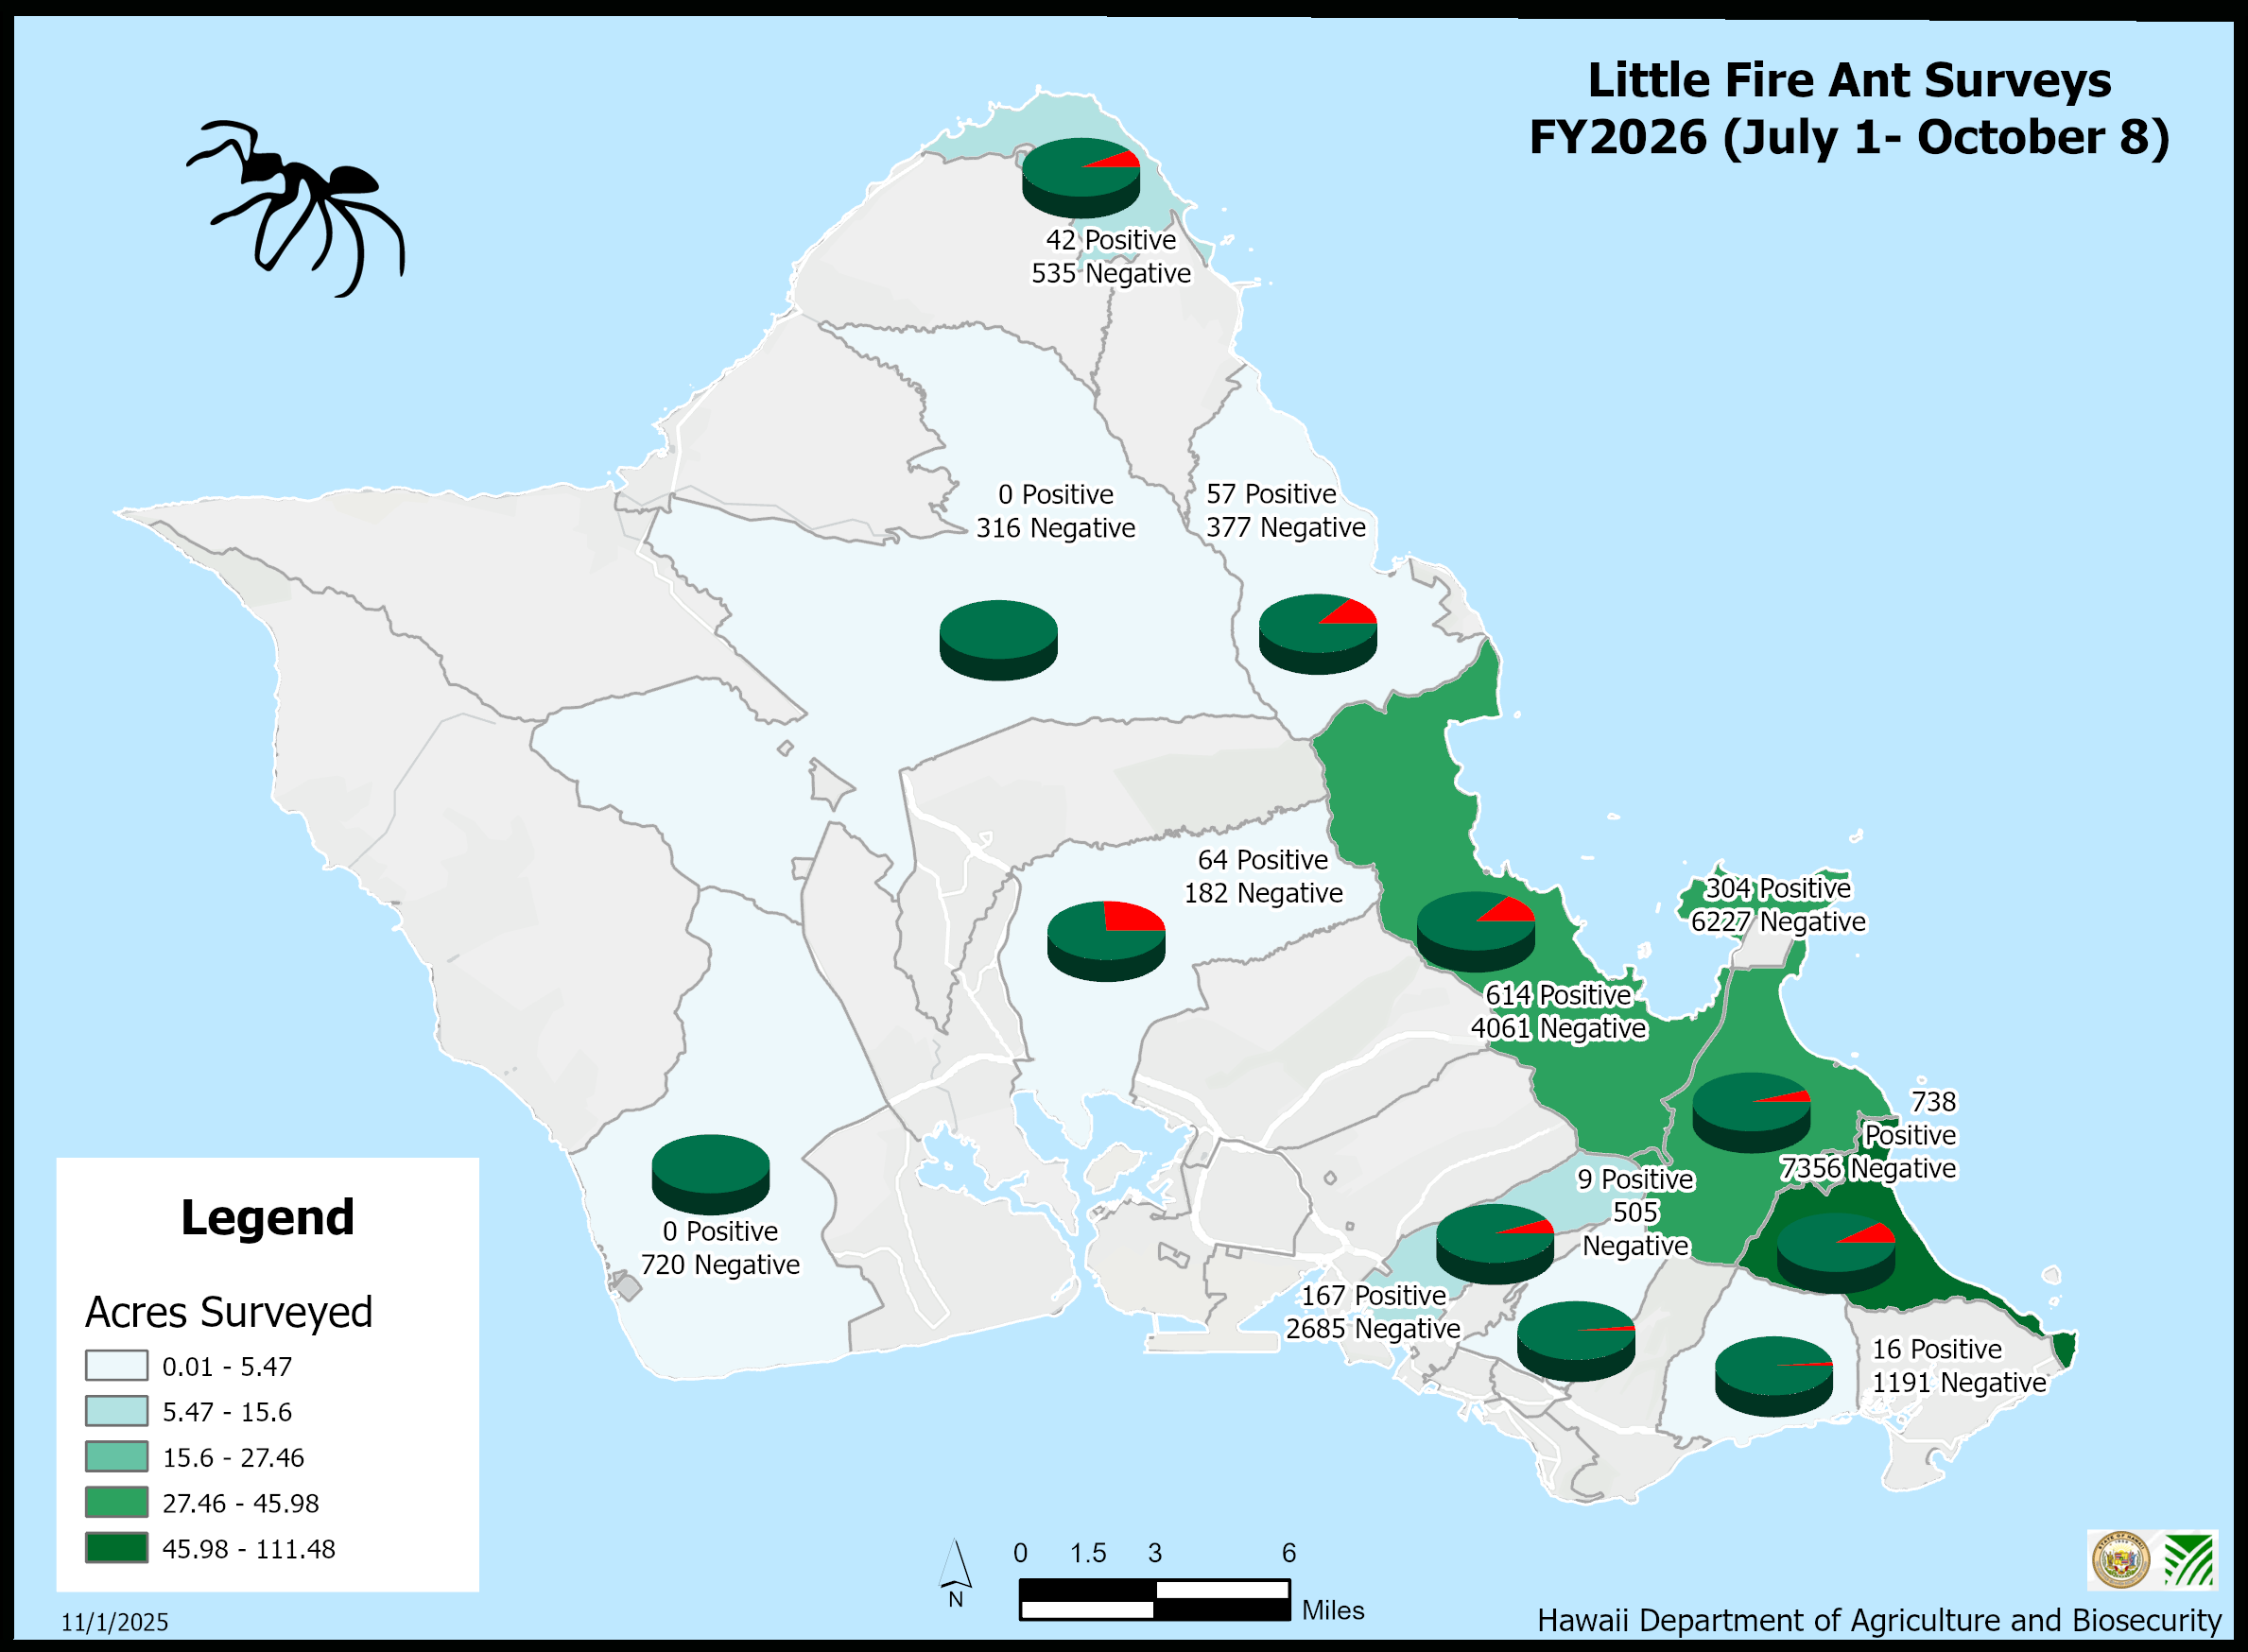
Map represents the number of positives and negative samples found in each Zip code for the Fiscal Year 2026 up until October 8, 2025. The darker the ZIP code, the more acres sampled.
The FY 2025 LFA Survey Data – Oahu dashboard shows the total number of samples along with the total positive samples collected by the Hawaii Department of Agriculture and Biosecurity during the State Fiscal Year 2025. It will also show the total acres surveyed for LFA and a breakdown of the different location types surveyed.
The bar graphs have survey sample breakdowns by ZIP code. Click on any of the bar columns in the two lower graphs to see the zip code location on the map. The data indicators will also report the details of the selected zip code.
The FY 2025 LFA Survey Data – Oahu Dashboard shows the total number of samples
The FY 2026 LFA Survey Data – Oahu dashboard shows the total number of samples along with the total positive samples collected by the Hawaii Department of Agriculture and Biosecurity for the State Fiscal Year 2026 up until the end of October 2025. It will also show the total acres surveyed for LFA and a breakdown of the different location types surveyed.
The bar graphs have survey sample breakdowns by ZIP code. Click on any of the bar columns in the two lower graphs to see the zip code location on the map. The data indicators will also report the details of the selected zip code.